
Lease vs Buy Calculator
Instant Lease vs Buy comparison: see term totals, average monthly, and Savings %.
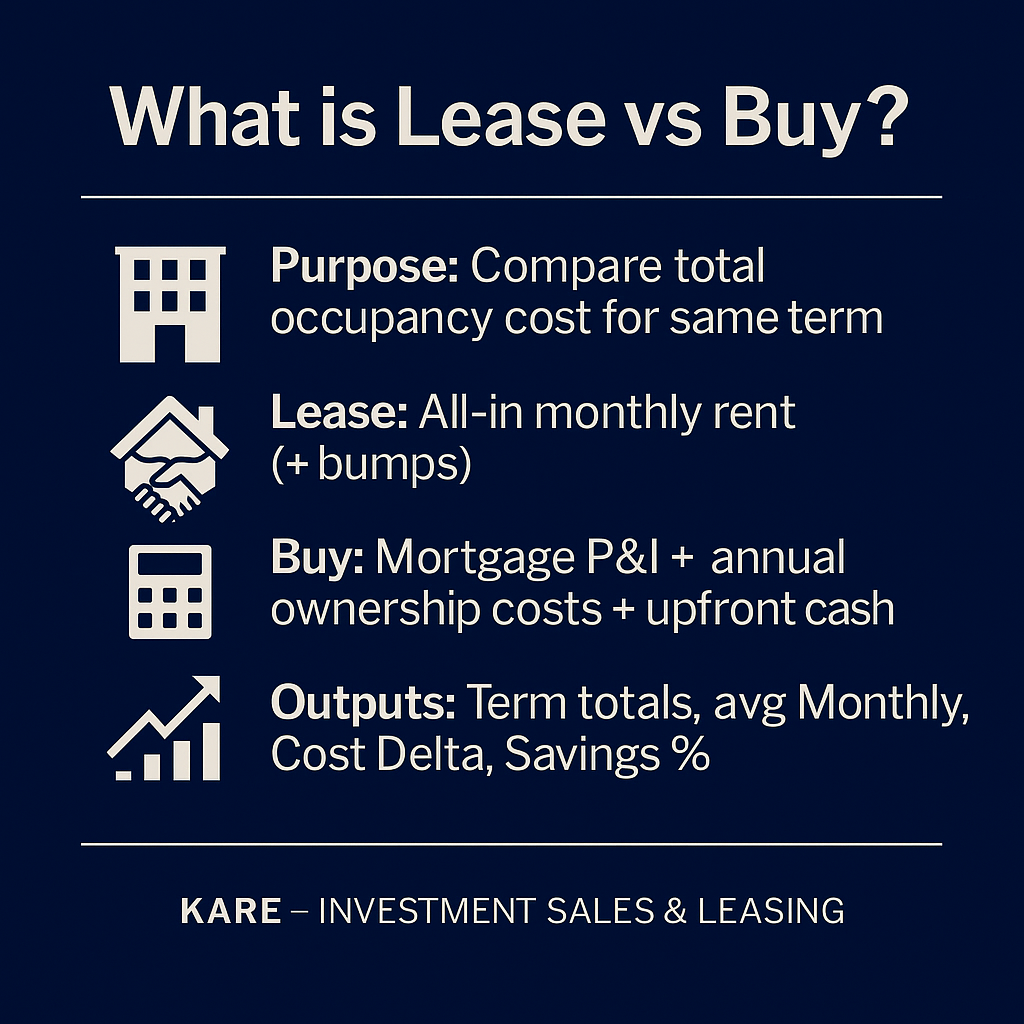
What is Lease Vs. Buy?
Lease vs. Buy compares the total cost of occupying space over your chosen term. The lease side totals your all-in monthly rent (plus any annual bumps), while the buy side adds mortgage P&I, annual ownership costs, and cash at closing. The summary clearly shows which option is cheaper for that term: a positive Savings % / Cost Delta means buying costs less; a negative value means leasing is cheaper..
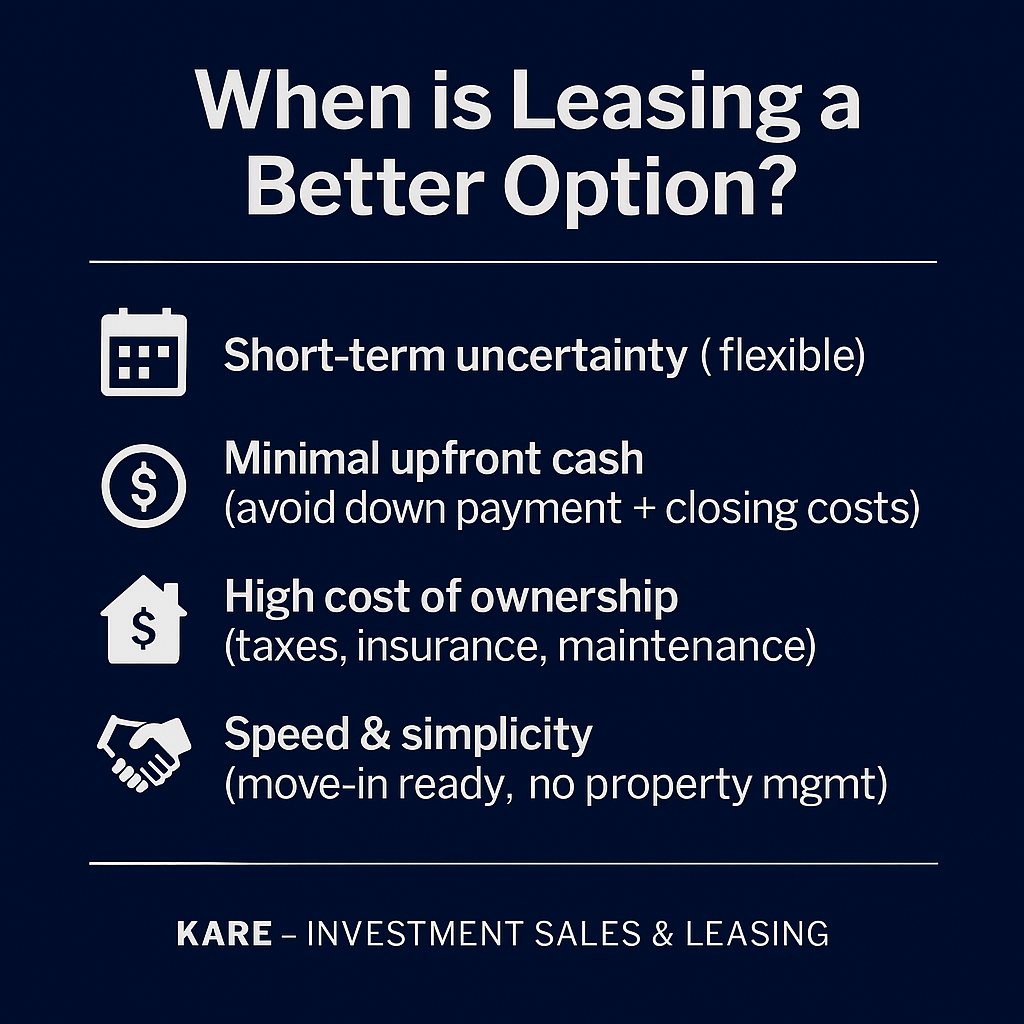
When is leasing a better option?
Leasing is often better when you need flexibility—short-term, uncertain headcount/location, or you want to conserve cash instead of funding a big down payment and closing costs. It can also win when the Avg Monthly Buy is higher than the Avg Monthly Lease or when you’d rather keep CapEx/maintenance risk with the landlord. In your calculator, leasing is cheaper whenever Savings % is negative (and Cost Delta < 0) for the chosen term.
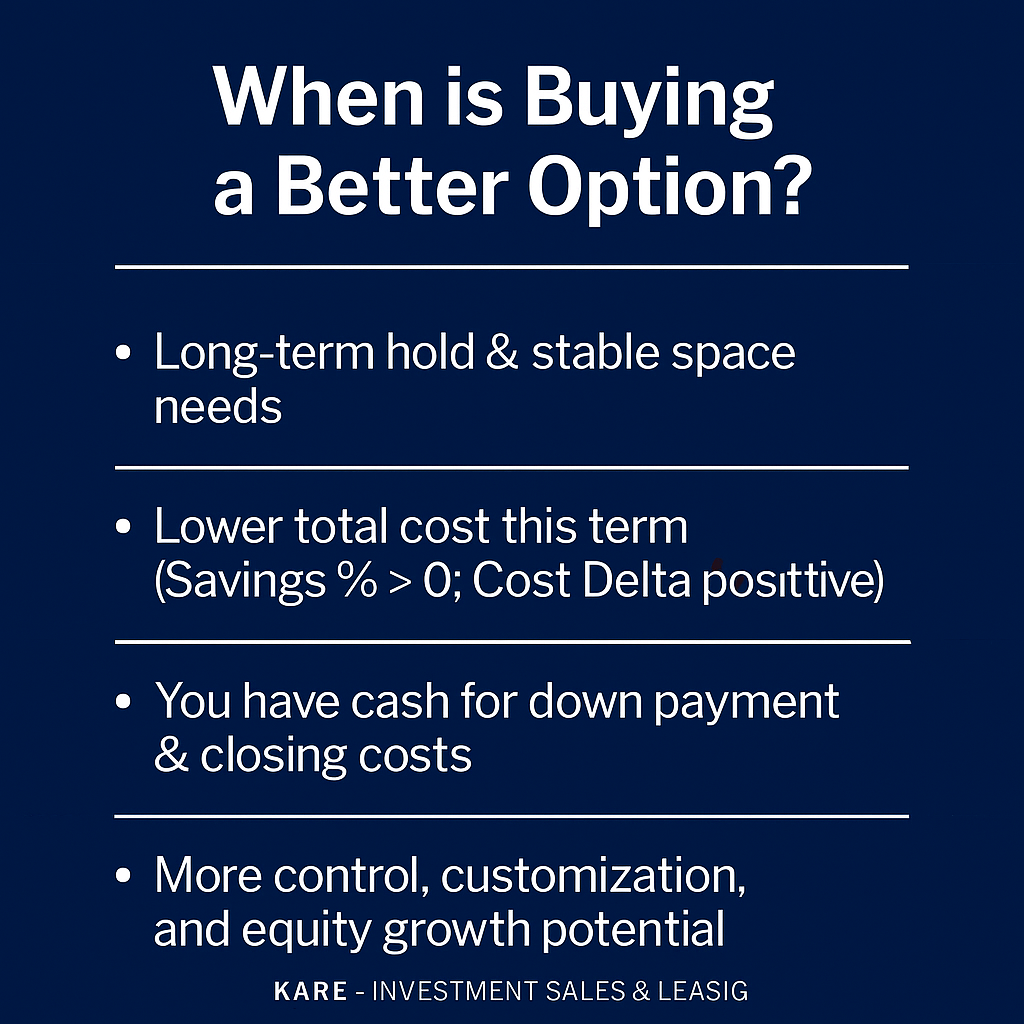
When is buying a better option?
Buying is usually better when you’ll occupy long term, have stable space needs, and can handle the up-front cash (down payment + closing costs). In the calculator, buying wins when Savings % is positive, Cost Delta (Lease − Buy) is > 0, and Avg Monthly Buy ≤ Avg Monthly Lease for your term. Outside this cost view, buying can also add equity build and control—just weigh CapEx reserves and financing risk.
.
FAQ
What does this calculator compare?
Total cost to lease vs cost to buy over a chosen term: term totals, average monthly, Cost Delta (Lease − Buy), and Savings %.
Which inputs do I need?
A Monthly Lease (all-in), B Term (months), C Annual Rent Bump %, D Monthly Mortgage P&I, E Annual Ownership Costs (taxes+ins+HOA/repairs), F Cash at Closing.
What counts as “all-in” lease?
Your base rent + NNN/OpEx (and any fixed fees). If NNN varies, use your best average.
What goes in Annual Ownership Costs ($/yr)?
Property taxes + insurance + HOA/repairs/reserves you expect each year. (P&I goes in D, not here.)
What is P&I?
Principal & Interest on your loan—your monthly mortgage payment excluding taxes/insurance/repairs.
How is the lease bump applied?
As a simple annual % translated to monthly compounding for the entered months. If your deal steps once per year, the result will be very close.
Does the buy side include my down payment?
Yes. Cash at Closing (F) is added to the buy total so the comparison reflects full cash out over the term.
Do results include equity build, appreciation, or tax effects?
No—this is a cost-only view. Use it for a clean apples-to-apples cash comparison. (We can add an “equity/exit” version if needed.)
How do I read Cost Delta and Savings %?
Cost Delta = Total Lease − Total Buy. Positive ⇒ leasing costs more.
Savings % = (Lease − Buy) ÷ Lease × 100. Positive % favors buy; negative favors lease.
What if I have free rent or a TI credit on the lease?
Approximate by averaging into A: e.g., 2 free months on $30k/mo for 60 months ⇒ set A ≈ 30k × 58/60 = 29k.
My N is small (±0–5%). What then?
It’s a toss-up on cost. Consider non-cost factors (flexibility, control, build-out timing) or run an advanced model with equity, CapEx, taxes, and exit.
What term should I use?
Use the period you’re deciding on (e.g., 60 months for a 5-year plan). Short-term favor leasing; longer, stable occupancy often favors buying.
Can I use this for investment property underwriting?
This tool is designed for owner-occupancy cost decisions. Investment deals typically need NOI, cap rates, vacancy, and exit—use a different model.
Why is my Savings % zero or unusual?
It shows 0% when the Total Lease and Total Buy costs are the same (or when lease inputs are blank/zero).
Does this replace financial/tax advice?
No—educational estimate only. For financing and tax implications, consult your lender and CPA before committing.


Disclaimer
The Lease vs Buy Calculator provided by KARE – Investment Sales & Leasing is for informational and educational purposes only. Results are estimates based solely on the numbers you enter and simplified assumptions; they are not predictions, guarantees, or advice. This tool focuses on cash cost only (term totals and averages). It does not model equity build, appreciation, tax effects (depreciation, interest deductions), opportunity cost of cash, interest-rate resets or prepayment penalties, variable NNN/CAM reconciliations, major capital expenditures, or unique lease concessions (free rent, TI, abatements) unless you embed them in your inputs. Actual outcomes depend on financing, market conditions, operating costs, and other factors that may change over time. This calculator does not constitute financial, investment, legal, or tax advice. Before making a decision, consult your lender/finance professional and CPA. By using this tool, you acknowledge that KARE – Investment Sales & Leasing is not responsible for actions taken or decisions made based on these results.